Heatmaps: endless visual insights

Heatmaps are built to show you what users engage with and what they ignore. No tagging or event creation required – just visual, easy insights.

See how Digital Experience Analytics features pair with Product Analytics for better insights. Learn more.


Image | Hero | Heatmaps
Image | Heatmaps | Visual Clarity

Extreme clarity on what's working and not

Get instant, visually compelling insights into your users' behavior. No technical expertise required – just pick a URL and analyze user behavior with precision. Use heatmaps to quickly identify user intent and build segments for deeper analysis.

Three kinds of Heatmaps

  • How to read clickmaps

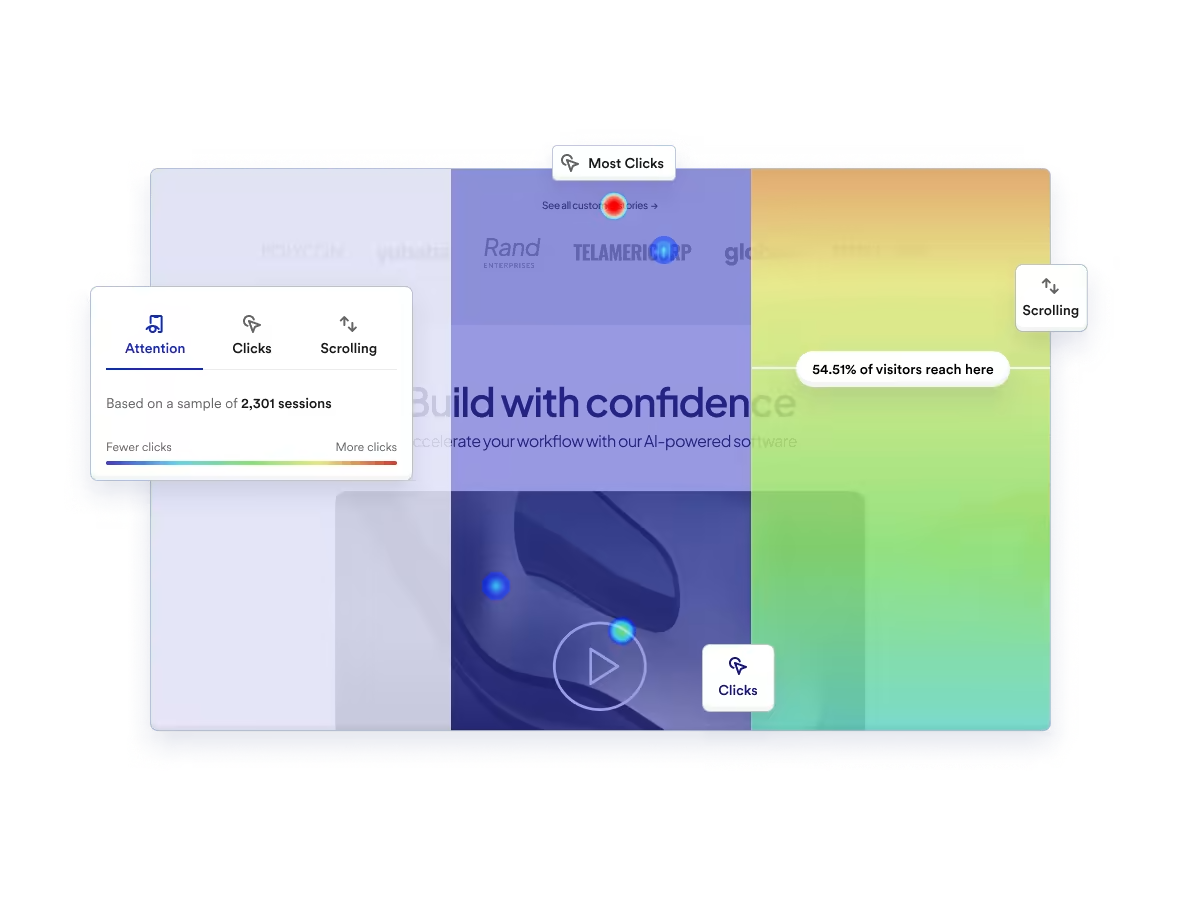
    Clickmaps

    Understand the impact of every page element by seeing what users click on — and what they don’t.

  • How to read scroll maps

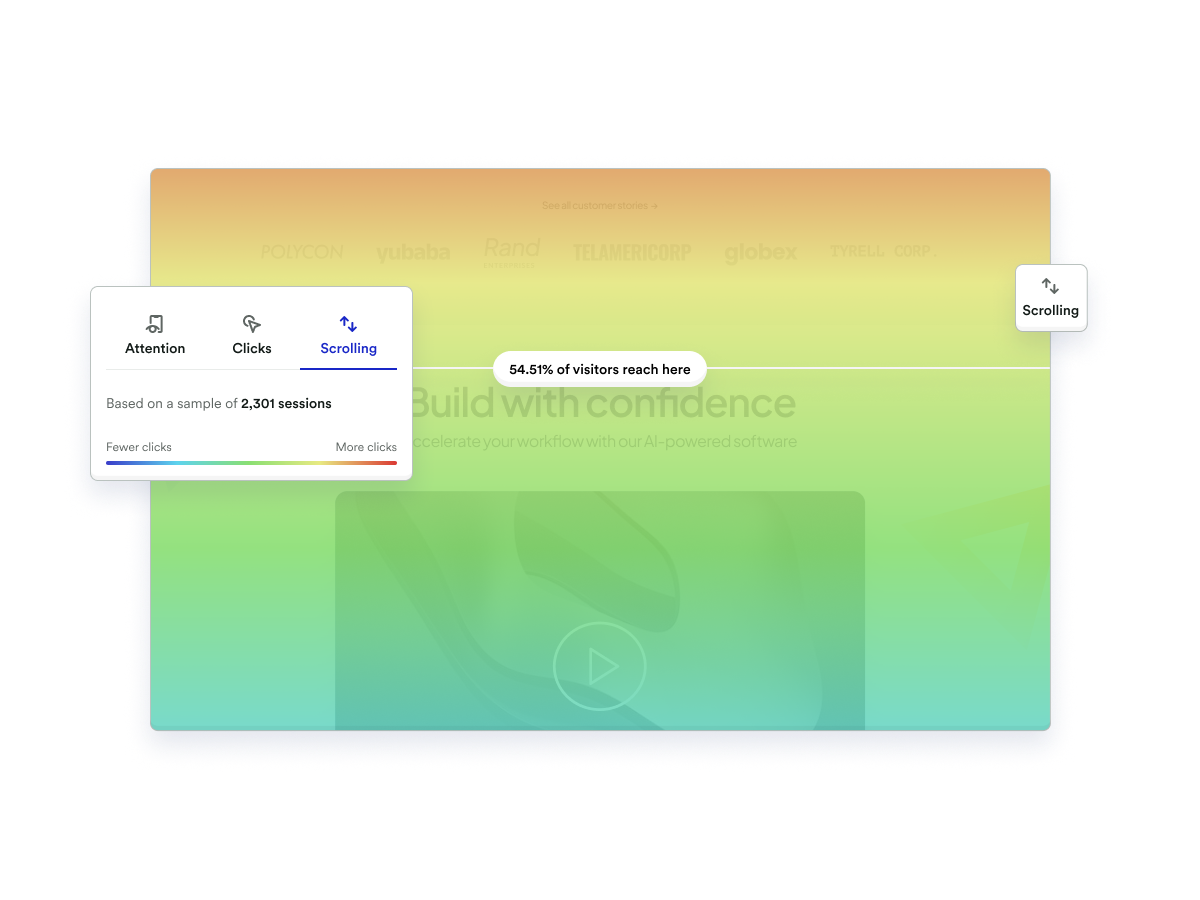
    Scroll Depth

    See how far users scroll down your pages. Not getting as far as you’d like? Use this information to optimize your layout and design.

  • Image of movement maps

    Attention Maps

    See where users focus their attention by following their cursor movement across your digital experience. Often a better measure of user behavior than clicks, since it shows you everything they focus on.

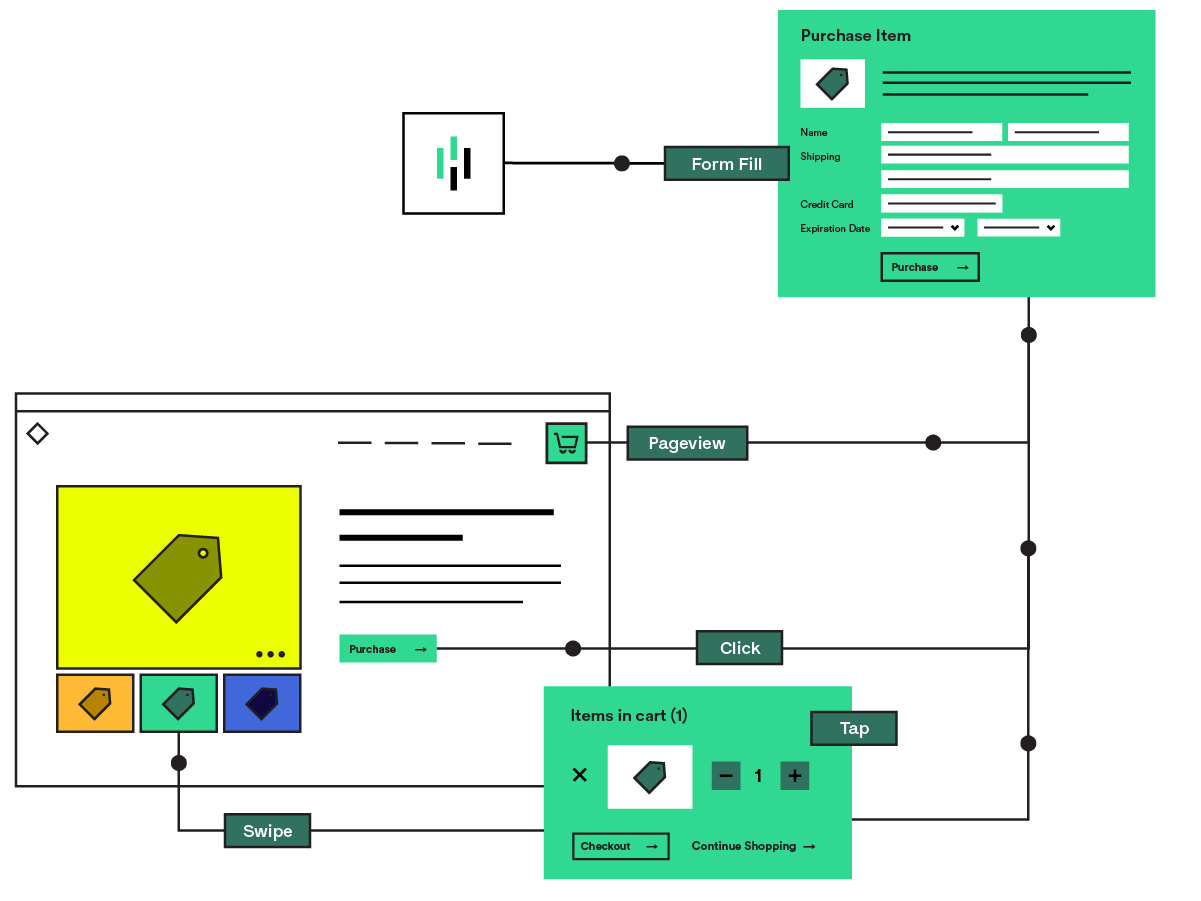
Website with various lines to important user tracking points such as pageview, form fill, click, tap and/or swipe. All data is directed to the Heap logo.

DXA + Product Analytics = the perfect solution

Digital experience analytics (DXA) tools like Heatmaps work best when users can go back and forth between them and more traditional product analytics. Get visual signals that show you where to look and the quantifiable analytics that help you understand impact. Learn more here.

See. Understand. Optimize.

Discover how you can gain instant, visually-compelling insights with heatmaps and build digital experiences that sizzle.