Your Average Revenue Per Customer is Meaningless
One of my friend’s startups recently had 3x growth in average revenue per customer from January to February. They went from earning an average of $230 per customer per month to just over $600 per customer per month. Did they up-sell their customers a new feature?
Had they changed their pricing model? What had happened was much simpler. They had landed a new, large client that was paying a few thousand dollars a month, driving up the average revenue per customer in their small customer base.
This illustrates an important lesson: average revenue per customer is a meaningless number.
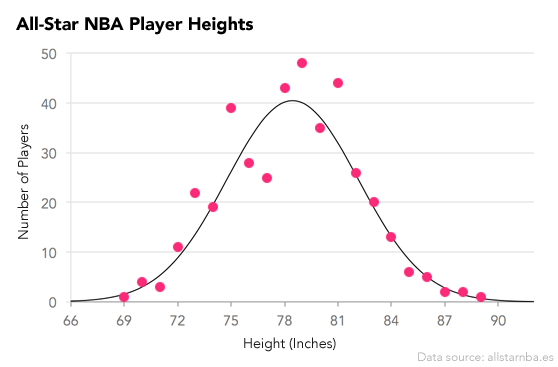
There are many datasets for which computing the average makes a lot of sense. For example, the average full-grown giant panda weighs 240 pounds. This tells you a lot about the weight of the next panda you come across. You may find some pandas that weigh 150 pounds or even 400 pounds, but you’re never going to encounter a 15,000 pound panda. The weights of pandas, SAT scores, and the heights of NBA players all follow a normal distribution.

However, revenue per customer for most online businesses is not one of those datasets where the average is meaningful. If your average revenue per customer is $600, it doesn’t mean that the next person who signs up will pay around that amount. The next customer could pay anywhere from your $10/month basic plan up to your $10,000/month enterprise plan.
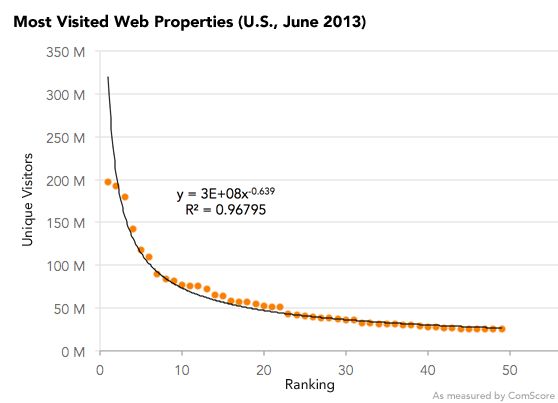
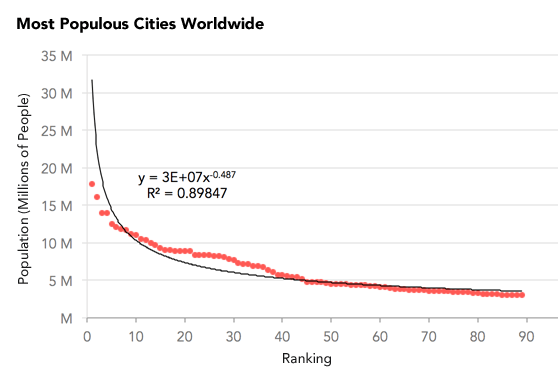
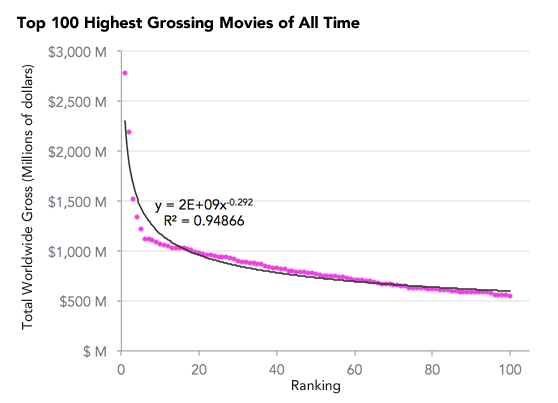
It’s likely that a small part of your customer base accounts for a large part of your revenue. Why does this happen? It turns out that for most businesses, revenue per customer follows a power law distribution. There are a lot of datasets that follow a power law rather than a normal distribution. The most visited websites, populations of cities, and movie box office revenues all follow a power law distribution.


The mathematical reasons behind why this happens are complex. In simple terms, power laws tend to emerge when there is extremely high variance in the data. One individual can have millions of times as much money as another. Therefore, wealth is likely to follow a power law. On the other hand, one individual can only be a few times taller than another individual at most, so heights of people follow a normal distribution. For many businesses, their revenue numbers are much more likely to fall into the former group than the latter.
Wait, but my per-customer revenue numbers don’t follow a power law!
There’s two main reasons why your business may not appear to fit the criteria above:
You don’t have many customers. For small amounts of data, individual randomness is likely to skew your data. These kinds of distributions will start to emerge as your business grows.
You’re leaving money on the table. Many software companies have pricing models that don’t capture the value being created by their product. For example, maybe you have a thousand total customers all paying exactly $15/month. It’s highly unlikely that all thousand customers value your product exactly the same, and you should therefore introduce higher pricing tiers. Figure out a pricing model that scales better with the amount of value you’re providing to each customer, and your revenue numbers will begin to fit a power law distribution.
Okay. But so what?
There are a few reasons you should care about how your revenue is distributed.
Take a look at the entire picture, not just the average. The average can betray the true health of the business. You might be earning a lot per month and have a high average revenue per customer, but if the majority comes from a couple large customers, then your revenue stream is fragile. Take a closer look at the actual underlying revenue data instead of blindly following revenue averages or totals.
Stop micro-optimizing your website based on average revenue numbers. Concluding that a certain A/B test variation was better because it yielded higher average revenue is likely to mislead you, if what happened was that one of the variations scored a large enterprise client by chance.
Be smarter about value-based pricing. There are a few customers to whom you’re providing an enormous amount of value. Maybe they’re large businesses where you’re creating thousands of dollars of value due to their size, or smaller businesses for whom your product is mission-critical. Either way, make sure your pricing captures as much of this value as possible.
This principle applies elsewhere in your product. A small subset of your customers provide most of your revenue. The same is true of the number of support tickets filed per customer, referrals per customer, level of engagement, the features that end up being most used, etc. Use this knowledge to better prioritize how you interact with your customers and what features you choose to build.
